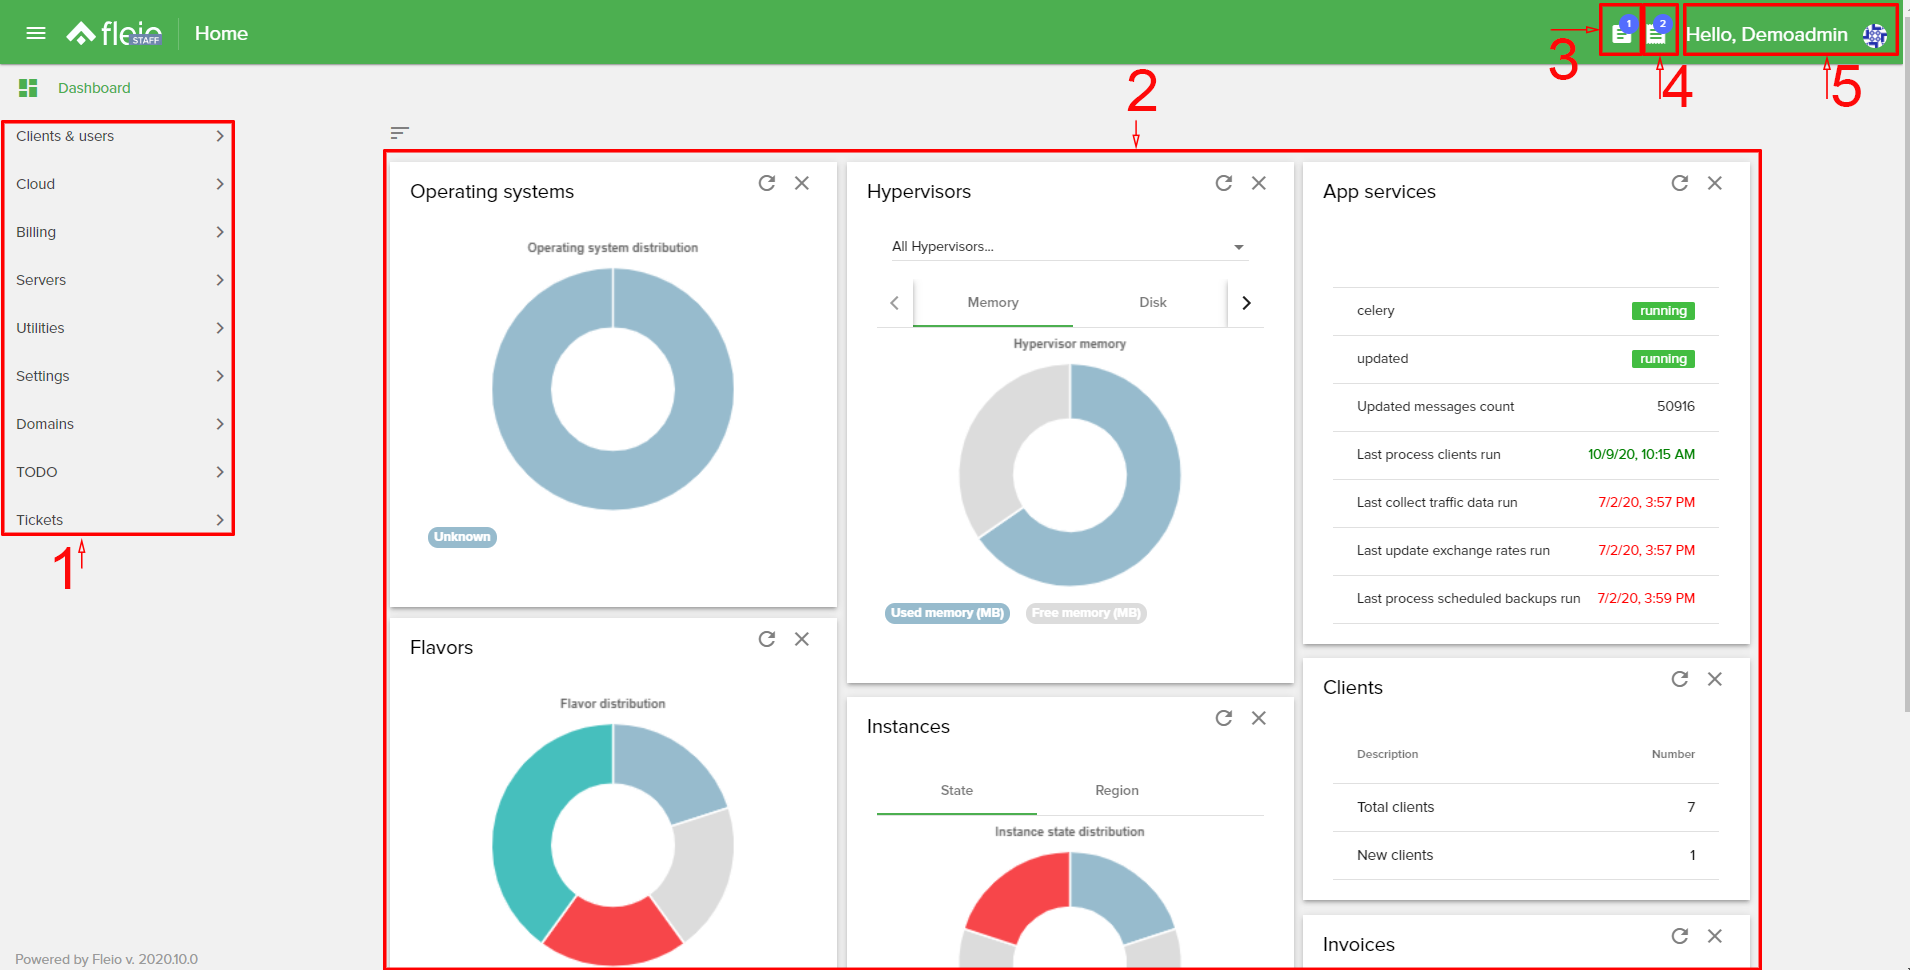
The main menu area contains these categories: Clients & Users, Cloud, Billing, Servers, Utilities,Settings, Domains, TODO and Tickets.
It can be hidden or displayed using the top-left button from the app.
Clients & Users / Users: See all users and manage them
User groups: See all user groups and manage them
Clients: See all clients and manage them
Client groups: See all clients groups and manage them
Instances: Manage instances. View details for instances
Clusters: Manage clusters. View details for cluster
Cluster templates: Manage cluster templates. View details for cluster templates
Networks: Create and manage networks. View details for networks
Routers: Create and manage routers. View details for routers
Ports: Manage network ports. View details for network ports
Zones: Manage DNS zones. View details for DNS zones
Cloud / Security groups: Manage security groups. View details for security groups
Subnet pools: Add or edit subnet pools. View details for subnet pools
Floating IPs: Manage floating IPs. View details for floating IPs
Flavor groups: Manage flavor groups. View details for flavor groups
Flavors: Create and manage flavors
SSH Keys: Manage SSH keys
Volumes: Manage volumes
Volume backups: Manage volume backups. View details for volume backups
Volume snapshots: Manage volume snapshots . View details for volume snapshots
Images: Manage created images and image snapshots
Projects: Manage projects. View details for projects
Api users: Manage API users
Journal: See a list of all the journals entries
Gateways: Enable payment gateways
Invoices: List all of the invoices and manage them
Services: Manage the services
Orders: See and manage orders
Products: Create or edit products/groups
Configurable Options: Crate and edit configurable options
Tax rules: Create and manage tax rules
Groups: View server groups. Create, edit and delete groups
Server list: View servers. Create, edit and delete servers
Activity log: See a list of activity logs
Operations: See a list of running, completed or failed operations
Reports: View reports. Create new reports or delete existing ones
General: Manage currencies and fleio license
Configurations: Create configurations for clients
Authorization: Manage users and user groups permissions
Notifications: Manage notifications such as new order notification, account credit low, suspension and termination notifications and so on
OpenStack: Set up your OpenStack settings
OpenStack plans: Create and manage OpenStack plans
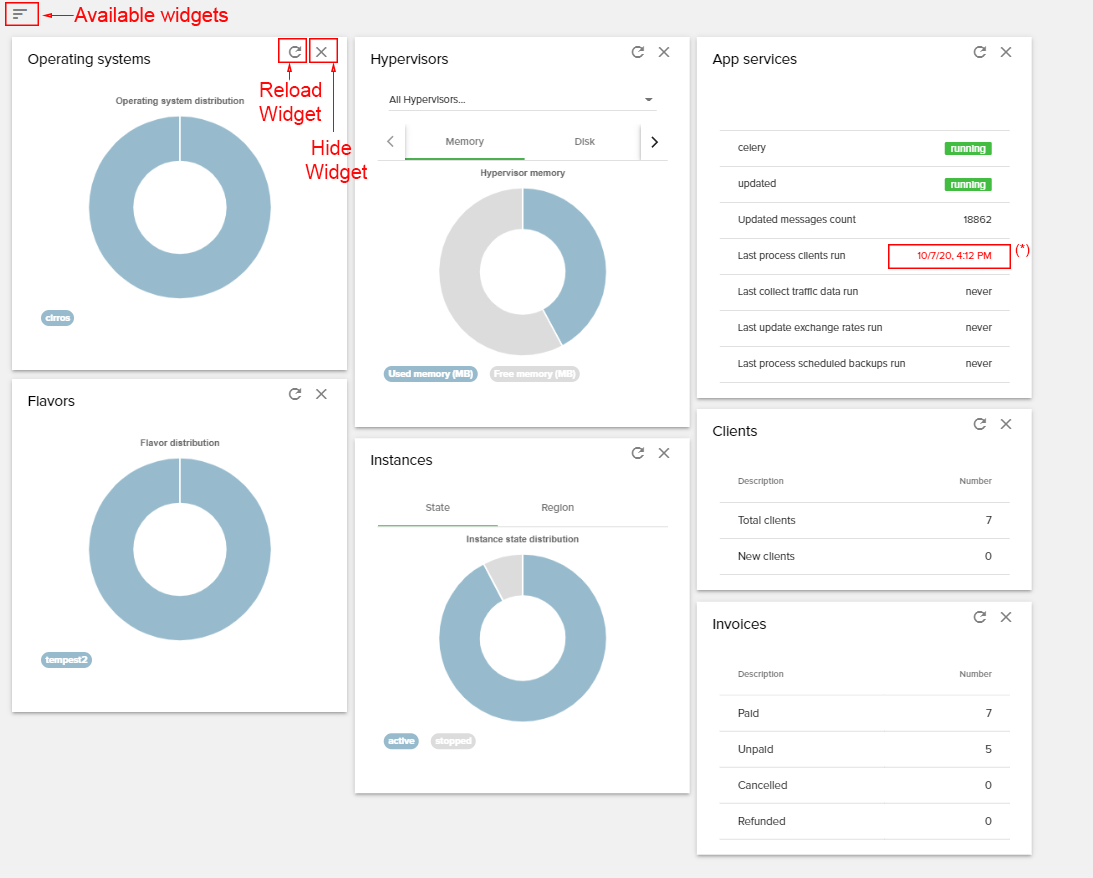
Here you can see a grid of widgets with different details about your application.

You can reload data from a widget or hide the widget from the panel using the highlighted buttons from the above image. If you want to add again a widget that you hid you can do so using the button from the top-left side of the panel like the one highlighted in the above image and you will get something like this:
(*) On the App services widget you will see the last date and hour that cron run. If the date is green, it means that the cron has run in the last 24 hours. If it’s red then it means that the cron did not run in the last 24 hours and needs attention.

